The Economic Value of Canada’s Tree Nursery Sector
Executive Summary
Download the PDF: Nursery-Sector-Economic-Analysis-Report_Jan-23_25.pdf
The Canadian tree nursery sector plays an important role in Canada’s economy. Canada’s tree nursery sector provides seedlings to reforest and restore forests in Canada. In doing so, the sector generates income and jobs, improves environmental conditions and enhances community resilience. Trees planted through these efforts sequester carbon, improve air quality, enhance climate resilience, and regulate water and soil systems.
Across Canada, the forest industry is legally required to regenerate Crown (public) forests that have been harvested for timber production. To meet this mandate, Canadian tree nurseries grow approximately 600 million seedlings annually, supporting a sophisticated supply chain that includes seed procurement, seedling production, and distribution. This is a large proportion of the total annual production of 726 million seedlings grown each year. Increased demands to restore forests affected by wildfires, pests, and extreme weather—alongside initiatives like the federal government’s 2 Billion Trees program—have amplified the sector’s importance.
Tree nurseries are also economically important for rural communities and a key driver of ecological sustainability. In late 2024, Green Analytics examined the direct, indirect and induced economic impacts of Canada’s tree nursery sector using input-output modelling. The analysis found that the Canadian tree nursery sector:
• Generates $256.3 million in annual revenue.
• Contributes $535.4 million annually to Canada’s gross domestic product (GDP).
• Creates 4,378 full-time-equivalent jobs across Canada.
• Contributes $737 thousand to GDP and results in 6.0 full-time-equivalent jobs for every one million seedlings grown.
Producing seedlings for forest restoration requires long-term planning and investment, with nurseries needing two to four years to plan for and grow seedlings in advance of planting.
As Canada faces escalating challenges to its forests from climate change, the tree nursery sector remains vital to the country’s ecological restoration and resilience. Sustained investments in this sector will secure economic returns and ensure the health and sustainability of Canada’s forests for generations to come.
Introduction
The Canadian Tree Nursery Association-Association Canadienne des Pépinières Forestières (CTNA-ACPF), established in 2023, is the national voice for Canada’s tree nurseries. Representing 60 nurseries across the country (Figure 1), all of which produce over 1 million seedlings annually — the CTNA-ACPF plays a pivotal role in Canada’s forest restoration initiatives. Collectively, its members grow more than 95% of the seedlings used in reforestation and ecological restoration efforts nationwide.
Green Analytics was commissioned by the CTNA-ACPF in 2024 to assess the economic impact of Canada’s tree nursery sector. As an independent consulting firm, Green Analytics specializes in natural resource management policy that balances environmental protection with economic benefits, utilizing high-quality social science research and analysis. With over a decade of experience in projects including regional natural capital assessments and socio-economic impact studies, they excel in statistical analyses, spatial analytics, and survey design. Green Analytics is committed to delivering evidence-based, objective results.
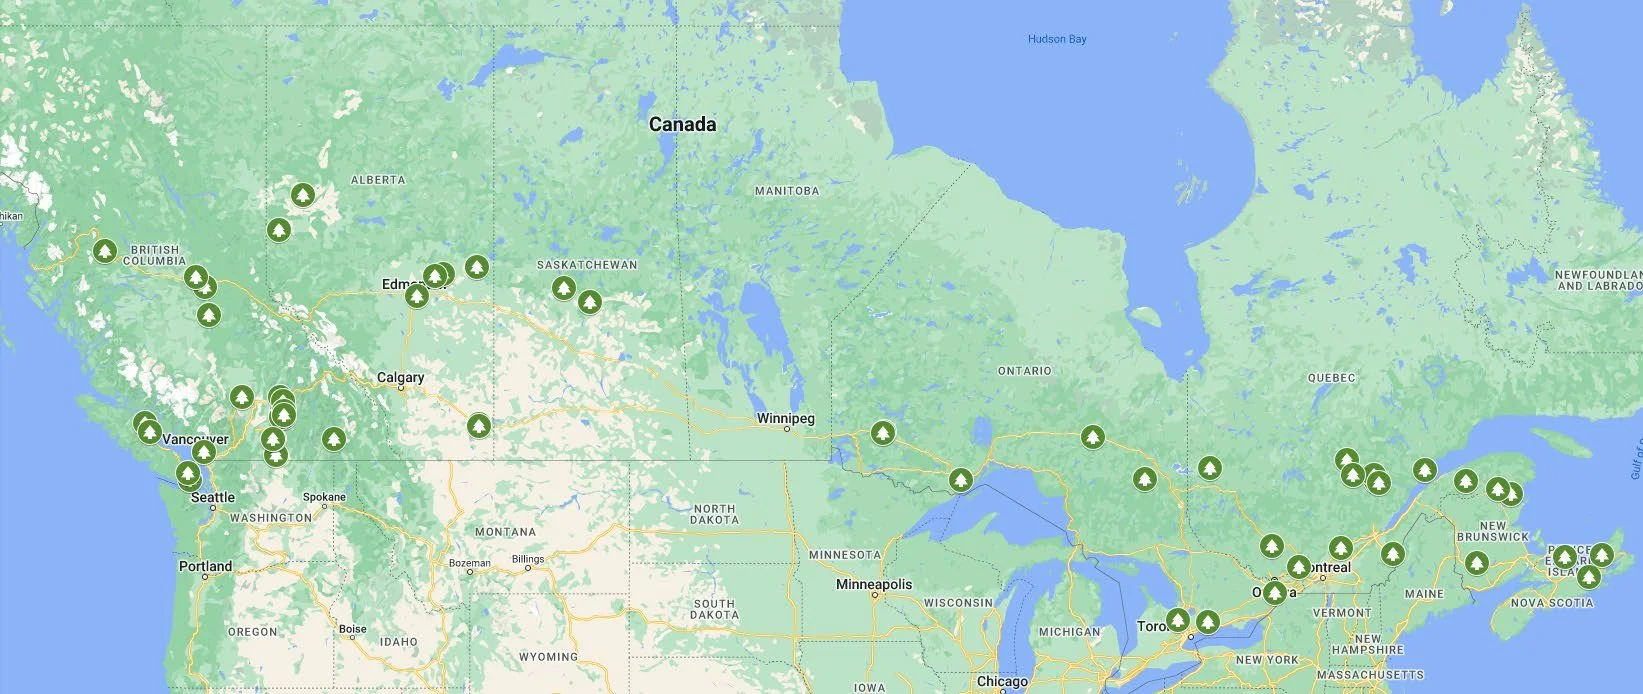
FIGURE 1. MAP OF TREE NURSERY CTNA-ACPF MEMBERS IN CANADA.1
The purpose of this report is to present the results of an economic impact assessment of Canada’s tree nursery sector. The analysis measured the direct, indirect and induced impacts of the sector on income, jobs and gross domestic product (GDP). The report consists of four sections. After this Introduction, an overview of the benefits of the forests supported by the tree nursery sector is presented. This is followed by a description of the approach and results of the economic impact assessment, highlighting the direct, indirect, and induced impacts in terms of jobs, income, and GDP. The report concludes with a summary of the key findings.
Canada’s Forests and the Tree Nursery Sector
Canada has over 362 million hectares of forests. Canadian tree nurseries specialize in providing high quality, native seedlings that are vital to the restoration of forests post-harvest and after disturbance such as wildfire, insect infestations and wind events. Indeed, the largest market for seedlings grown by Canadian tree nurseries is for reforestation of Crown forests post-harvest. This accounts for a total annual production of 600 million seedlings.
Across the country, forests replanted with Canadian nursery seedlings provide economic benefits, including to rural, remote and Indigenous communities. The forest sector supports over 300 forest-reliant communities and directly employs 212,660 Canadians, including over 11,000 Indigenous people.2
Large scale forest restoration efforts whether undertaken by the forest industry post-harvest or through initiatives such as the federal Two Billion Tree (2BT) program stimulate job creation in forestry, nursery management, and conservation sectors, supporting local economies. The 2BT program is estimated to result in 4,300 new jobs in tree planting, nursery work, and other forestry-related positions (Government of Canada 2021b). As of fall 2024, 2BT has commitments to plant 716 million seedlings by 2031 with 20% of all 2BT projects being Indigenous led.
In addition to economic benefits, Canada’s forests provide ecological services to Canadians including carbon storage and sequestration. Restored forests enhance water and soil regulation (preventing water pollution and reducing soil erosion) and provide habitat. While few seedlings from CTNA-ACPF members are planted in urban areas, those that are help reduce extreme heat, alter wind speeds, and block solar radiation (Nature Canada 2021). Additional benefits of urban tree planting include reducing heat-related illnesses and enhancing mental and physical health (Pataki et al. 2021).
Economic Impact Assessment of the Canadian Tree Nursery Sector
This section outlines the results and inputs of the economic impact assessment of the tree nursery sector. Tree nurseries produce seedlings (outputs) for sale to end users by first purchasing intermediate inputs, initiating a chain reaction of interindustry sales and purchase transactions. This assessment measures the economy-wide effects of the economic stimuli created by Canada’s tree nursery sector.
To estimate the economic impacts of tree nurseries across Canada, Green Analytics used Statistics Canada's input-output (I-O) multipliers (refer to Appendix A for a description of I-O multipliers). These multipliers, derived from I-O models representing industry interrelationships, illustrate how one sector's stimulation affects others and the overall economy. For instance, a $1 million purchase of machinery by a tree nursery directly stimulates the machinery industry, resulting in indirect expenditures as that industry buys raw materials. This creates a chain of spending, generating total economic impacts greater than the initial stimulus.
The total economic impact encompasses direct, indirect, and induced effects. Direct impact arises from initial expenditures, indirect impact from subsequent spending by intermediate industries, and induced impact from wages spent by households on consumer goods and services.
For this analysis, 2019 provincial I-O multipliers from Statistics Canada were used. 2019 was selected as the year for analysis as the multipliers from that year are considered more reflective of the pre-pandemic economic structure. Although the 2019 multipliers are lagged, inter-industry relationships remain stable over time, making them suitable for assessing the tree nursery sector's total economic impact.
Canadian Tree Nursery Production Survey
Tree nurseries are a key component in a complex forest restoration supply chain that includes seed collection, processing, storage, seedling production, tree planting agencies, landowner outreach, long-term monitoring and follow-up treatments and reporting. It takes two to five years for nurseries to plan for and grow seedlings for forest restoration purposes. This requires significant long-term investment by the nurseries for both staff and infrastructure to ensure the right trees are available when required. The CTNA-ACPF estimates that 663 million seedlings are grown annually in Canada by its member tree nurseries, with an additional 63 million seedlings grown by non-member nurseries, for a total of 726 million seedlings grown annually in Canada (Table 1). The vast majority of these seedlings are planted in Canada with a relatively small number of trees sent for export (18 million) (Pike et. al 2023).
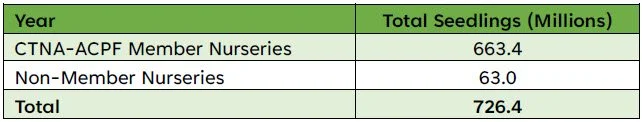
TABLE 1: ANNUAL SEEDLING PRODUCTION IN CANADA
The total economic impact includes the economic effects of all intermediate and final transactions in the economy stemming from the direct economic stimulus. To establish the total economic impact of Canada’s tree nursery sector, it was necessary to first estimate the direct economic stimulus. The direct economic stimulus is equal to the total annual seedling sales value from the nursery sector. This was obtained in 2024 through a survey of 30 CTNA-ACPF nurseries across Canada. The survey collected primary information on tree nursery production location(s), the volume of annual production, the types of seedlings produced, the variety of species sold, and the sale price and percent of total sales for each species produced.
According to the survey, over the five-year period from 2019 to 2023, total annual production among the 30 surveyed nurseries averaged 276 million, with an annual average production per nursery of 10 million (Table 2). The survey sample captured 42% of the current annual production volume from CTNA-ACPF member tree nurseries (276 million out of 663 million), and 38% of Canada’s total production including non-member nurseries (276 million out of 726 million), making the survey results statistically representative of the industry.
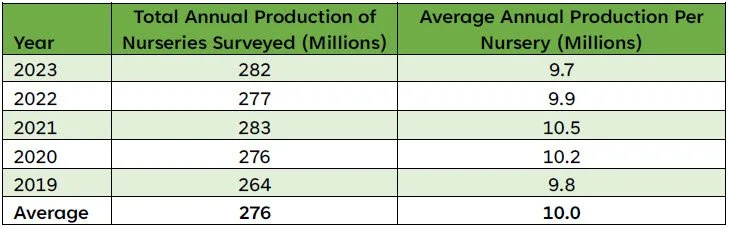
TABLE 2: SURVEY DATA ON ANNUAL PRODUCTION
The survey also identified the top 5 species sold by each nursery. A total of 34 species were identified across the 30 surveyed producers’ top 5 species sold. White Spruce, Black Spruce, White Pine, Lodgepole Pine, and Interior Douglas Fir appeared in the highest frequency, accounting for the majority (52%) of species identified as the top 5 sold (Table 3).

TABLE 3: SURVEY DATA OF TOP 5 SPECIES SOLD BY PRODUCERS
The survey gathered data from nurseries on the average sale price of the top five species sold by each producer and their percentage share of total sales, categorized into quintiles: 0-20%, 20-40%, 40-60%, 60-80%, and 80-100%. The median percentage of each quintile was used (10%, 30%, 50%, 70%, and 90%). It also collected average sale prices for each species in $100 increments per 1,000 seedlings sold.
To represent the sale price of the average seedling sold, a weighted average was calculated based on the price of the top 5 species sold multiplied by the share of the top 5 sales that each species comprised. Based on this analysis, it was identified that the weighted-average sales price per 1,000 seedlings was $352.83 in 2024 (Table 4).

TABLE 4: WEIGHTED AVERAGE SALES PRICE PER 1,000 SEEDLINGS
The weighted average sale price per 1,000 seedlings ($352.83) became an input to calculating the direct economic impact of the tree nursery sector (described below).
Direct Economic Impact
The weighted average sale price per 1,000 seedlings of $352.83 was used to calculate the direct economic impact of Canada’s tree nursery sector by multiplying the price per 1,000 seedlings ($352.83) by the number of seedlings sold. With CTNA-ACPF tree nurseries producing approximately 663 million seedlings annually, and non-member nurseries producing an additional 63 million seedlings, the total annual sales value of seedlings was estimated to be $256,292,216 (Table 5).
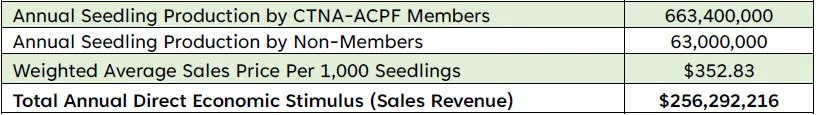
TABLE 5: TOTAL ANNUAL DIRECT ECONOMIC STIMULUS
The total annual sales value of $256.3 million represents monies flowing into the Canadian tree nursery sector from the sale of tree seedlings. This revenue figure represents the direct economic impact of Canada’s tree nursery sector, which is the stimulus used to estimate indirect and induced impacts. Collectively, the direct, indirect and induced impacts form the total economic impact of the sector.
Indirect and Induced Economic Impact
As is noted above, the annual direct economic impact of Canada’s tree nursery sector is $256.3 million (Table 5). This is the amount of money flowing directly into Canada’s tree nursery sector each year. This direct impact results from the production and transaction of seedlings in Canada over a year.
The total economic impact (the sum of direct, indirect and induced impacts) in an average year from this direct stimulus was calculated using I-O multiplier analysis. In contrast to direct economic effects, total economic effects include the value of intermediate and final goods and services produced in a year that result from the economic activity of tree nurseries. The economic impact assessment applied in this analysis estimates the Canada-wide economic impacts on GDP and the number of full-time-equivalent jobs created.
The direct economic impact stimulus—$256.3 million in total sales revenue—was disaggregated by province by distributing total revenue according to each province’s share of seedling production (Table 6). The purpose of distributing total revenue by province was to allocate a share of the total direct impact stimulus to each respective provincial multiplier table; I-O multipliers for each province vary slightly due to differences in the industrial structure of each provincial economy. The estimated sales revenue for each province shown in Table 6 was used to calculate the multiplier effects throughout Canada’s economy.
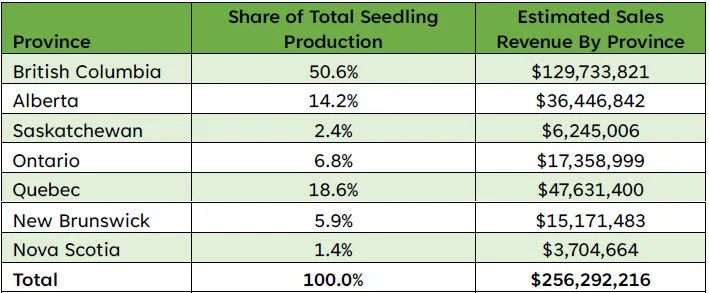
TABLE 6: DISTRIBUTION OF SALES REVENUE BY PROVINCE
GDP and employment impacts resulting from the nursery sector are shown in Table 7. In an average year, tree nurseries throughout Canada generate $535.4 million in Canadian GDP.
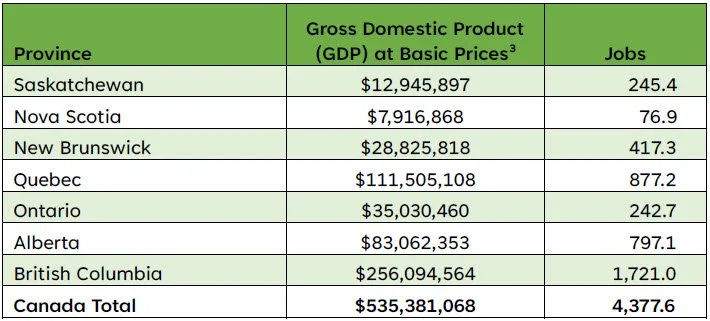
TABLE 7: TOTAL ECONOMIC IMPACTS
SOURCE: STATISTICS CANADA TABLE 36-10-0595-01; CALCULATIONS BY GREEN ANALYTICS.
GDP refers to the value of all final goods and services produced in a given period. GDP is the most common measure for the size of an economy, or the size of impact an industry sector has on the broader economy, and is thus universally used as a comparator, within countries, across countries, and across time periods. When one industry sector’s contribution to GDP is estimated, it enables the total output comparisons with other industry sectors, or with the same industry sector in previous years to observe how the sector has grown or shrunk.
Canada’s tree nursery sector contributes 4,378 full-time-equivalent jobs to the economy. This measure includes full-time, part-time, and seasonal positions. A full-time-equivalent job represents the total hours worked divided by the average annual hours of a full-time job, meaning that multiple part-time or seasonal workers can equal one full-time position over a year. For instance, two individuals working half the hours of a full-time worker for a year count as one full-time job.
Conclusion
The Canadian tree nursery sector not only contributes to the delivery of crucial ecological restoration and biodiversity efforts but also economic development in often rural locations. It currently generates significant economic benefits, contributing $256.3 million from seedling sales each year and sustaining 4,378 jobs. The annual contribution of $535.4 million to GDP underscores its substantial impact on the national economy. For every 1 million seedlings grown, Canada’s tree nursery sector contributes $737 thousand to GDP and results in 6.0 full-time-equivalent jobs.
Driven by the increasing occurrence and severity of forest fires in Canada, the contribution of Canada’s tree nursery sector is poised to grow. Figure 2 illustrates the area of forest burned and the number of forest fires in Canada between 2000 and 2024. As detailed by the most recent data from Canadian Interagency Forest Fire Centre (CIFFC), the total area burned in Canada in 2023 exceed 17 million hectares – a record number. While the total areas burned was much lower than in 2023, the area burned in 2024 was still more than 5.3 million hectares. To provide a comparison, the 2023 burned area is about 20 times the area of Greater Toronto or 50 times the area Greater Vancouver. Similarly, the burned area in 2024 is approximately 6 times the size of Greater Toronto or 15 times of the size of Greater Vancouver.

FIGURE 2. FOREST AREA BURNED AND NUMBER OF FOREST FIRES IN CANADA, 2000 - 2024. DATA OBTAINED FROM CIFFC.
The CTNA-ACPF recently calculated that to restore only 15% of the forests burned by wildfires in 2023 and 2024 would require 5.3 billion seedlings. Based on the weighted average cost of a seedling in Canada, growing 5.3 billion additional seedlings would create $3.9 billion in GDP, and 30,986 full-time-equivalent jobs. This significant increase in demand for seedlings reflects just two years of wildfires with a 15% restoration rate.
As the importance of this sector is set to grow in the coming decade, driven by factors such as climate change and wildfire risks, continued investment is essential. By fostering the growth of tree nurseries, we can simultaneously improve environmental health and rural economic resilience, creating a sustainable future for ecosystems and local communities. Continued investment in this sector will ensure sustainable growth, bolstering rural economies while promoting a thriving, biodiverse, and climate-resilient future.
References
Canadian Tree Nursery Association. 2023. Canadian Tree Nursery Association/Association Canadienne des Pépinières Forestières (CTNA-ACPF) 2023 Atlantic Forest Nursery Conference. Accessed 22 Oct 2024. https://static1.squarespace.com/static/64e8baf3556f8012954944d0/t/6553d8d63a0b4525a018c856/1699993817124/2023_10_26_2023_Atlantic+Tree+Nurseries+Conference_CTNA_Launch.pdf
Canadian Tree Nursery Association. n.d. Seedling Sustainability: Canada’s Tree Nursery Advocate. Accessed 22 Oct 2024. https://ctna-acpf.ca/
Cavard, X., Macdonald, S.E., Bergeron, Y. and Chen, H.Y., 2011. Importance of mixedwoods for biodiversity conservation: Evidence for understory plants, songbirds, soil fauna, and ectomycorrhizae in northern forests. Environmental Reviews, 19 (NA), pp.142-161.
Davis, H. Craig. 1990. Regional Economic Impact Analysis and Project Evaluation. Vancouver, BC: University of British Columbia Press.
Government of Canada. 2021a. 2 Billion Trees Commitment: The power of trees. Accessed 22 Oct 2024. https://www.canada.ca/en/campaign/2-billion-trees/the-power-of-trees.html
Government of Canada. 2021b. The Government of Canada provides an update on planting Two Billion Trees. Accessed 22 Oct 2024. https://www.canada.ca/en/natural-resources-canada/news/2021/06/the-government-of-canada-provides-an-update-on-planting-two-billion-trees.html
Government of Canada. 2024a. Planting the right tree in the right place for a better tomorrow. Accessed 22 Oct 2024. https://www.canada.ca/en/campaign/2-billion-trees/how-we-plant-trees-and-how-it-helps.html
Government of Canada. 2024b. 2 Billion Trees Commitment: Our Action How we will get there together. Accessed 22 Oct 2024. https://www.canada.ca/en/campaign/2-billion-trees/our-action.html
Lal, Kishori. 2001. Evolution of the Canadian Input-Output Tables: 1961 to date. System of National Accounts Branch. Statistics Canada. Catalogue no. 13F0031MIE2001009.
Natural Resources Canada. 2023. The state of Canada’s forests. Annual report 2023. Accessed 22 Oct 2024. https://natural-resources.canada.ca/sites/nrcan/files/forest/sof2023/NRCAN_SofForest_Annual_2023_EN_accessible-vf(1).pdf
Nature Canada. 2021. What Is Canada’s Two Billion Tree (2BT) Program and What Is the Opportunity? Accessed 22 Oct 2024. https://naturecanada.ca/news/blog/what-is-canadas-two-billion-tree-2bt-program-and-what-is-the-opportunity/
Northwest Territories Bureau of Statistics. 2006. NWT Input-Output Model: An Overview. Government of the Northwest Territories. Accessed 5 September 2024. https://www.statsnwt.ca/economy/multipliers/NWT%20IO%20Model-Overview.pdf
Pataki, D.E., Alberti, M., Cadenasso, M.L., Felson, A.J., McDonnell, M.J., Pincetl, S., Pouyat, R.V., Setälä, H. and Whitlow, T.H., 2021. The benefits and limits of urban tree planting for environmental and human health. Frontiers in Ecology and Evolution, 9, p.603757.
Pike, Carolyne C. Diane L Haase, Scott Enebak, Annakay Abrahams, Elizabeth Bowerstock, Lori Mackey, Zhao Ma and Jim Warren, 2023, Forest Nursery Seedling Production in the United States – Fiscal Year 2022, Tree Planters Notes, Volume 66, No. 2.
Schaffer, William. 1999. “Regional Impact Models.” Ed. Scott Loveridge. The Web Book of Regional Science. Morgantown, WV: Regional Research Institute, West Virginia University. Accessed 6 September 2024. https://researchrepository.wvu.edu/cgi/viewcontent.cgi?article=1006&context=rri-web-book
Pike, Carolyne C. et. al, 2023, Forest Nursery Seedling Production in the United States – Fiscal Year 2022, Tree Planters Notes, Volume 66, No. 2.
Statistics Canada. Table 36-10-0595-01. Input-output multipliers, provincial and territorial, detail level
Statistics Canada. 2011. The Input-Output Structure of the Canadian Economy 2008. Ottawa, ON: Statistics Canada Input-Output Division, Catalogue no. 15-201-X. Accessed 5 September 2024. https://publications.gc.ca/collections/collection_2011/statcan/15-201-X/15-201-x2011001-eng.pdf
Tang, T., Zhang, N., Bongers, F.J., Staab, M., Schuldt, A., Fornoff, F., Lin, H., Cavender-Bares, J., Hipp, A.L., Li, S. and Liang, Y., 2022. Tree species and genetic diversity increase productivity via functional diversity and trophic feedbacks. Elife, 11, p.e78703.
ten Raa, Thijs. 2005. The Economics of Input-Output Analysis. New York, NY: Cambridge University Press.
Tree Canada. n.d. Supporting community planting for long-term benefits. Accessed 22 Oct 2024. https://treecanada.ca/grants-awards/treemendous-communities/
United Nations. 2008. System of National Accounts. Brussels/Luxembourg, New York, Paris, Washington, D.C.: Prepared under the auspices of the Inter-Secretariat Working Group on National Accounts - Eurostat, International Monetary Fund, Organisation for Economic Co-operation and Development, United Nations Statistics Division, World Bank.
Appendix A: Framework for Conducting the Economic Impact Assessment
Economic impact analyses represent conditional predictive assessment models that provide quantitative estimates of economic phenomenon.4 They are predictive in that they forecast direct and indirect effects on the economy from stimulus imputed into the model by the researcher, and conditional in that they hinge on certain theoretical assumptions. These types of studies produce statements of the form: “if, under assumption a, b, and c, a stimulus x is applied to the local economy, then impacts y and z are likely to result.”5
Direct and Indirect Impacts
Due to the interconnectedness of markets, a stimulus or disruption to one industry sector will affect other sectors directly linked to it. Following this reasoning, through a complex network of linkages, industries that are indirectly linked to the affected sector will also be affected. Sectors are directly linked if an economic transaction occurs between them, for example, a purchase or sale. When an industry manufactures a good, it must purchase its inputs from other firms, whom concurrently sell their outputs to the purchasing sector. An indirect linkage occurs when sectors are reliant on each other, but not directly. For example, if sector A purchases from B, and B purchases from C, it is said that A and C are indirectly linked. In this hypothetical three-sector economy, if sector C undergoes an output disruption, sector B will experience an impact to its production process, which will create an economic ripple effect to the production of sector A.
Input-Output Analysis
We utilize input-output (I-O) models to calculate provincial economic impacts. I-O models are inter-industry impact models that capture economy-wide output effects from a shock to any one sector. These models link all industries into a complex network of sales and purchase linkages, allowing both indirect and direct effects to be captured from exogenous changes in final demand. The information of sectoral linkages is contained within a symmetric matrix that accounts for inputs and outputs of all industries.
The I-O approach is based on the idea that most industries of an economy are interconnected—either directly through transactions, or indirectly through competition for labour, capital, and land in the production process. By accounting for the economy-wide effects, as opposed to the effects of only the directly affected sector, a more complete picture of economic impacts is made available. No matter the initial disturbance (negative impact) or stimulus (positive impact), industries realign their inputs and outputs interdependently to adjust to new economic equilibrium.
Input-Output Multipliers
I-O models capture industrial interdependencies within an economy. An impact to one economic sector generates a series of ripple effects that induce a long chain of inter-industry interactions. This closed-loop effect continues until the economy returns to equilibrium.6 In an open I-O model, two effects are derived from these spending rounds: direct impacts and indirect impacts. The calculation of these two effects produces Type I multipliers. In the closed I-O model, an additional effect is also calculated: induced impacts. The calculation of direct, indirect and induced effects produces Type II multipliers.
Direct effects are those associated with the initial industry expanding output to meet the new demand or contracting output to account for the new economic disruption. This initial industry must purchase its factor inputs from other sectors in order to manufacture its commodity—for example, automobile producers must first purchase steel. Indirect effects are those associated with the “other” sectors: as they expand or contract output to meet the requirements of the principal industry’s demand, they must too purchase inputs from other sectors. This chain of interactions continues until infinity.7 For example, if the automobile sector contracted output, it would purchase less steel from the steel manufacturer, whom in turn would purchase less iron ore to account for the decreased steel production, and so on.
Induced effects are calculated when the household sector is incorporated into the model. This process is referred to as endogenizing the model in respect to households and involves linking household sales (in the form of labour) and household purchases (in the form of consumer activity) to the inter-industry system. This effectively allows the household sector to behave like an industry sector, partaking in both selling (labour) and purchasing (consumption). Returning to the simplified example of an automotive industry, if output is reduced, steel consumption will also be reduced; this will result in both sectors decreasing output and decreasing their input of labour into manufacturing. In effect, the household sector will receive less wage and salary income and spend less in the economy on consumer goods. This is the essence of the induced economic effect.
These Type I and II output effects are yielded in the form of output multipliers. An output multiplier denotes the increase or decrease in sector A’s output, from a final demand disruption or stimulus to sector C. For example, if C’s output increased by $1,000, an output multiplier of 1.27 for A would mean A’s output would increase by $1,270.